Technology Is the Answer, Not the Pitch – an SBI Credit Card Story

Last week I was at HiLite Mall in Thrissur with my family, headed into Lulu Hypermarket, when a sales executive from SBI Card stopped me near the entrance.

“Are you planning to take a credit card?”

“No,” I said. “I already have an HDFC and an ICICI card.”

She wasn’t ready to let go that easily. “But this one gives you cashback for every ₹100 you spend.” I still wasn’t convinced — I’ve heard that pitch a hundred times, and two cards in my wallet were plenty.

So I asked her a simple question: “I drive about 15,000 km a year. What’s in it for me, specifically?”

Here’s the thing — she knew the card inside out. Cashback percentage, the fact that it was tied specifically to BPCL fuel purchases, the reward structure, all of it. What she couldn’t do was the next step: take my number — 15,000 km a year — and turn it into a rupee figure that meant something to me. The feature was solid; the translation from feature to my life was missing.
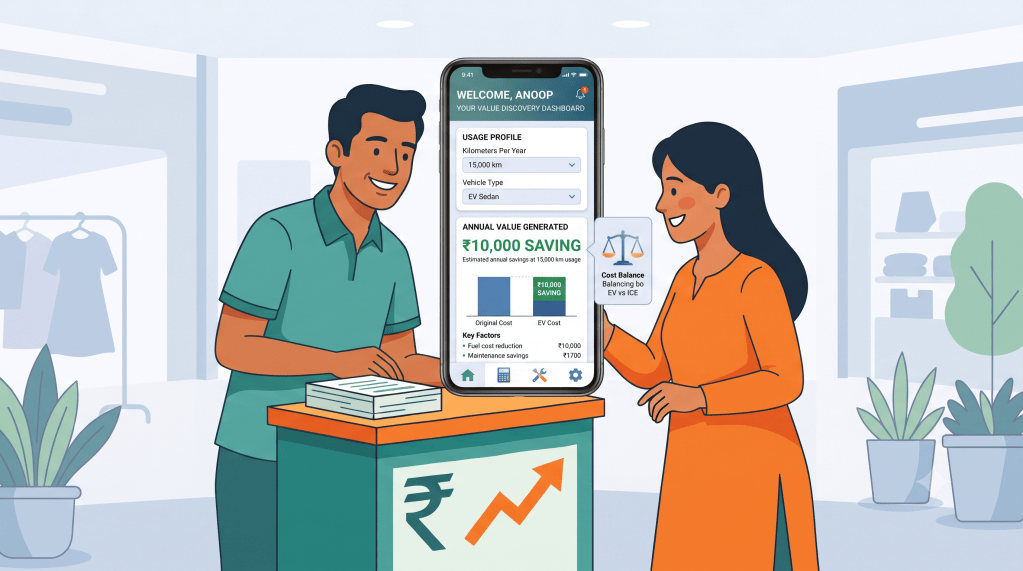
A smiling man at a counter using a mobile app displaying savings data for electric vehicle usage, while a woman looks on, both surrounded by a retail environment.

So I pulled out my phone, opened the calculator, and we worked it out together, right there at the kiosk.

Continue reading “Technology Is the Answer, Not the Pitch – an SBI Credit Card Story”

Data-Driven Decisions: Explained Over a Drink

A few weeks back, over drinks with friends in Sydney, I was sitting back, holding a cold beer in my hand.

Ravan leaned over, grabbed another chilled bottle from the bucket, and offered it across the table. “Shivam, Have a beer with us.”

Shivam waved his hand dismissively, swirling the ice in his glass. “No way, yaar. Why would I switch to a light beer when I’m already drinking whiskey? Whiskey, vodka, brandy—that’s the real stuff. Beer won’t even hit the spot.”

Everyone around the table nodded in agreement. And on paper, they weren’t wrong. Beer typically sits around 4% to 5% alcohol, while whiskey sits way up at 40% to 42.8%.

Case closed, right?

I looked down at the bottle in my hand, turned to Shivam, and said, “Wait a minute. Let’s not close the case yet.”

The Question Nobody Was Asking

Everyone was comparing the percentage. Nobody was comparing the quantity.

Think about it. When you drink whiskey, how much do you actually pour? A peg is usually 30ml, sometimes 60ml if you’re generous. But when you drink beer, you are not sipping 30ml from a shot glass. You are opening a full bottle — 330ml, 500ml, sometimes 650ml.

So the real question is not “which drink has more alcohol in it.” The real question is “which drink puts more alcohol in you.”

And that, my friends, is where the data tells a completely different story.

Continue reading “Data-Driven Decisions: Explained Over a Drink”

The Pressure Cooker Whistle: Explaining My New Job

I am writing this from thousands of feet above, on my way to Seattle for Confluent’s Global Kick Off 2026.

It’s been three months since I joined. Looking back, leaving my previous role wasn’t easy. I was comfortable. I knew Azure like the back of my hand. Moving here meant leaving that safety net for a completely new technology stack. I have always loved technology, and I learned everything put in front of me. But the biggest change isn’t just the tech—it’s how I explain my job.

Continue reading “The Pressure Cooker Whistle: Explaining My New Job”